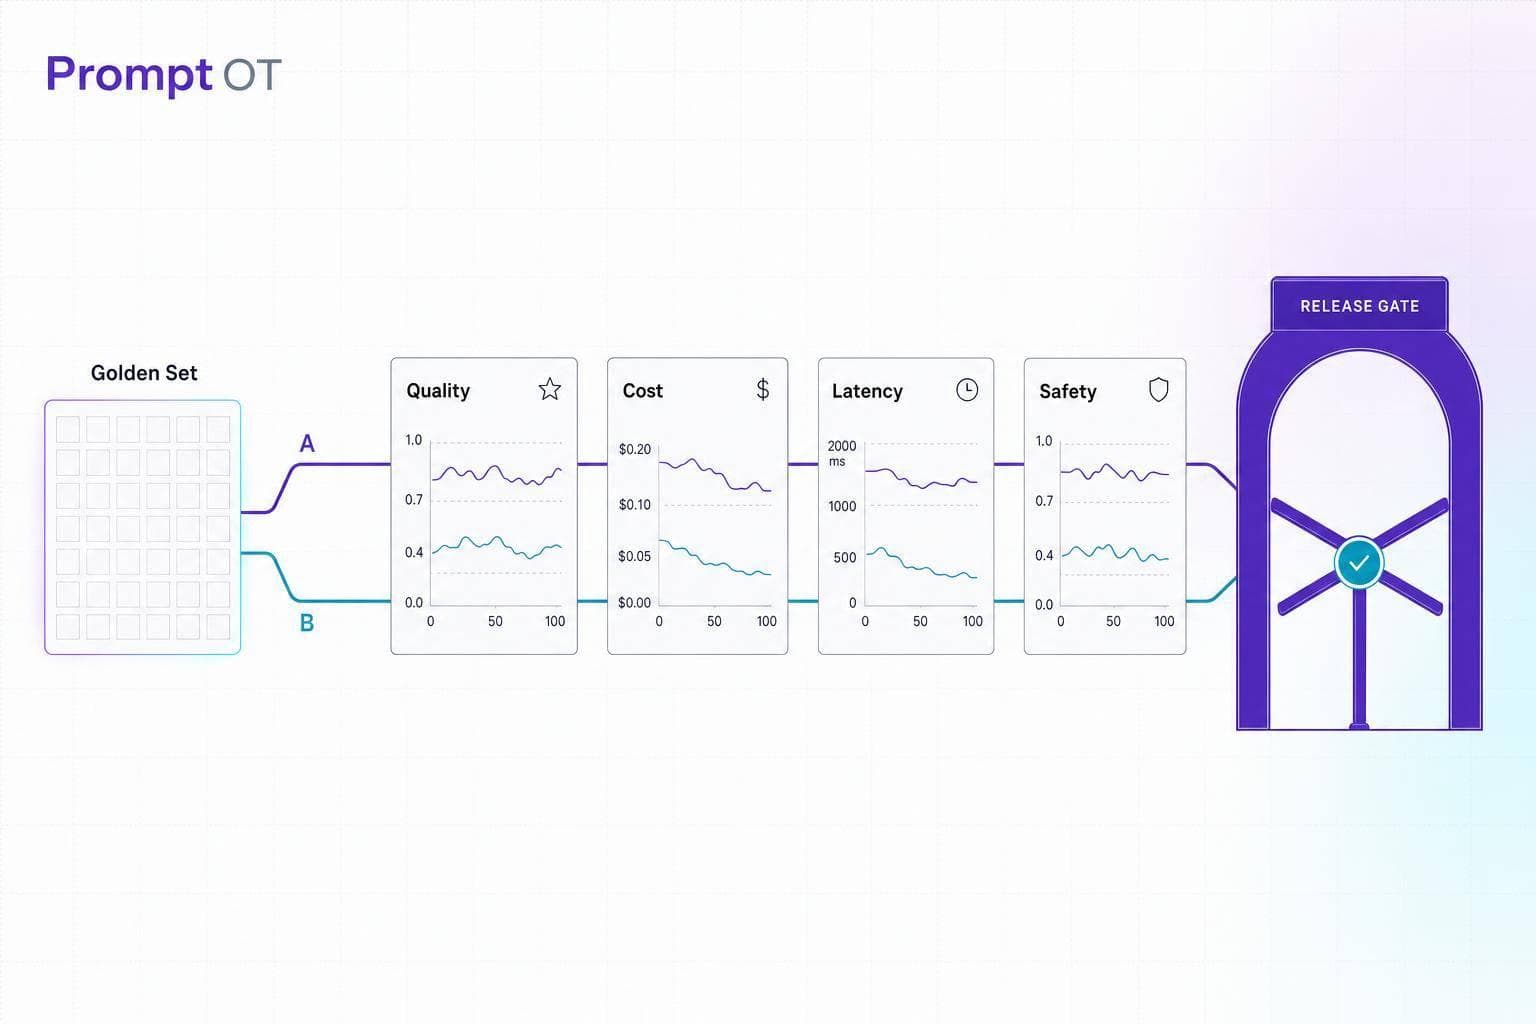
If I had to sum up prompt evaluation in one line, it’s this: I don’t ship prompt changes based on gut feel - I ship them based on scores.
Here’s the short version:
- I test prompts on a golden set of real examples
- I track 3–5 metrics across quality, cost, latency, and safety
- I use the same metrics every time so version-to-version results are comparable
- I mix rule checks, LLM judges, and human review
- I use paired offline tests or live A/B tests to check whether a change actually improved results
- I set release gates in advance, like minimum F1, max p95 latency, or max failure rate
- I monitor 1%–5% of live traffic after launch to catch drift and new failure cases
A few numbers stand out. In the article, 20–50 examples is a starting point for a test set, while 100–200 examples gives steadier scoring. A 10-point lift may need about 194 samples per variant, but a 2-point lift can need about 5,000. And if I test 3 metrics at alpha = 0.05 without correction, the false-positive rate climbs to about 14%.
What matters most is simple: pick the metric first, test on real inputs, compare prompt versions on the same cases, and block releases when a key score slips. That turns prompt work from guesswork into a process I can track.
Below, I’ll walk through the article’s main ideas in plain English: what to measure, how to score prompts, how to compare versions, and how to wire all of that into production.
How to Systematically Setup LLM Evals (Metrics, Unit Tests, LLM-as-a-Judge)
sbb-itb-b6d32c9
Match Metrics to the Prompt's Task
There isn't one metric that tells you whether a prompt is good. You need a small set of metrics that fits the job. In practice, that means using the same metric set every time you compare prompt versions, and choosing 3–5 metrics that cover quality, cost, latency, and safety. Pick the metric set first. Scoring comes after that.
Task Quality Metrics: Accuracy, F1, Exact Match, and Groundedness
Exact match is the most direct check: does the output match the expected string exactly?
It works well for structured outputs like JSON fields, entity extraction, or code snippets. But it's too strict for chat-style answers. One small formatting change counts as a miss, even if the answer is right.
Accuracy and F1 are better fits for classification and detection work. Accuracy shows the overall share of correct outputs. F1 balances precision and recall, which matters when classes are unevenly distributed - for example, when you're trying to flag rare policy violations in a content moderation prompt.
Groundedness, sometimes called faithfulness, checks whether the model's answer is supported by the context you gave it instead of made up. It's the main metric for RAG workflows. And here's the catch: a response can look good and still fail groundedness if it adds claims that don't appear in the retrieved documents.
A prompt can score well on quality and still do poorly on speed or safety. That's why system metrics need to come along for the ride.
System Metrics: Latency, Token Usage, Cost, and Failure Rate
Quality metrics tell you how good the output is. System metrics tell you what it costs to get there.
Track latency at median, p95, and p99. Averages can hide slow outliers, and those outliers are often what users feel most.
Token usage connects straight to cost. Multiply input and output tokens by the model's per-token price to get cost per request in USD. More context may improve answer quality, but that doesn't always make it a good deal if the prompt also pushes up cost or slows response time.
Failure rate tracks malformed outputs, schema violations, and safety refusals.
The table below sums up the main metric types, when to use them, and where they fall short.
| Metric | What It Measures | When to Use It | Data Required | Limitations |
|---|---|---|---|---|
| Exact Match | Character-level identity | Classification, extraction, code | Reference answer | Too rigid for creative or conversational text |
| F1 / Precision / Recall | Balance of accuracy and coverage | Detection, retrieval, classification | Labeled dataset | Harder for non-technical stakeholders to interpret |
| Groundedness | Claims supported by source context | RAG, source-based Q&A | Source documents + output | Requires LLM-as-judge; subject to model bias |
| Rubric Score (1–5) | Subjective quality (tone, helpfulness) | Summarization, creative writing | Rubric + output | Slower; needs calibration against human scores |
| P95 / P99 Latency | Tail response time | Interactive, user-facing applications | Production logs | Doesn't measure output quality |
| Token Usage / Cost | USD cost per request | Budget planning, scaling decisions | API metadata + model pricing | Doesn't reflect whether the output was good |
| Failure Rate | Malformed outputs, schema violations | CI/CD gating, production stability | Validation rules or schema | Doesn't capture quality of successful outputs |
Safety and Stability Metrics for Production Applications
For production prompts, safety should sit in the core metric set right next to quality and latency.
Robustness checks whether a prompt gives consistent outputs across repeated runs with the same input. If the same input leads to high variance, the prompt is unstable. Prompt-injection resistance also needs its own test. You can't just assume a prompt is safe because it looks fine in normal cases.
Track policy violations and refusal rates as separate metrics. A prompt that refuses too often blocks legitimate requests. A prompt that refuses too rarely creates risk. If you want to improve either one, you need to measure both first.
Once the metric bundle is set, the next move is building test cases and comparing prompt versions in a consistent way.
How to Run Quantitative Evaluations Correctly
Getting the metric right is only half the work. The other half is running evaluations in a way that gives you results you can trust and use.
Build Evaluation Datasets From Real Tasks and Edge Cases
A metric only helps when the test set looks like real traffic. That means building evaluation datasets from production data, not made-up examples. Pull from production logs, support ticket archives, or beta user logs. Real inputs show how people actually write: messy phrasing, unclear requests, odd edge cases, and all.
When you sample, don't just grab the latest logs and call it a day. Split by intent type, user tier, and input complexity. A big sample with weak variety can still miss where the system breaks. It's smarter to start with a small but varied set of real cases, then grow it by adding failures and edge cases over time.
Every production failure should go into the golden set and stay there as a regression test. Add minimal inputs, ambiguous queries, off-scope requests, and adversarial inputs too.
Once you have a stable golden set, you can score each case with the cheapest method that still fits the task.
Combine Rule-Based Scoring, Similarity Scoring, LLM Judges, and Human Review
No single scoring method works for every prompt type. The practical move is to stack methods based on what the task needs.
Rule-based checks are the fastest, cheapest, and fully reproducible option for binary constraints like JSON schema, regex, and length limits. They're the best first pass for structured output tasks.
Use ROUGE or BERTScore when you have reference outputs and exact matching would be too rigid. ROUGE measures recall against a reference. BERTScore uses embeddings to judge semantic similarity, not just word overlap.
For open-ended traits like helpfulness, tone, groundedness, and instruction adherence, LLM-as-judge is the practical option at scale. It can handle nuance that rule-based checks miss, but there's a catch: the judge should be stronger than the model being tested, such as GPT-4o or Claude 3.5. It can also pick up verbosity bias and position bias. That's why human review still matters. A solid pattern is to compare 100–200 annotated examples against LLM scores using Cohen's kappa or Pearson correlation.
One habit is worth baking in from the start: strip prompt version labels and randomize output order before any evaluation pass, whether it's done by people or automated systems.
| Method | Strengths | Weaknesses | Infrastructure Needed | Best-Fit Use Cases |
|---|---|---|---|---|
| Rule-Based | Fast, cheap, and 100% reproducible for binary checks | Only works for clear right/wrong answers | Regex, JSON schema validators | Format compliance, length bounds, schema checks |
| Similarity (ROUGE, BERTScore) | Objective comparison to reference | Misses semantic correctness | Reference datasets | Summarization, translation |
| LLM-as-Judge | Scalable, captures meaning and intent | Inherits model bias; requires periodic human validation | Strong judge model (e.g., GPT-4o, Claude 3.5) | Helpfulness, tone, groundedness, open-ended tasks |
| Human Review | Highest signal; ground truth for high-stakes domains | Slow, expensive, and hard to scale | Rubrics, annotation UI, domain experts | Edge case curation, judge calibration, creative writing |
Once each prompt version has a score, compare variants on the same test cases and with one fixed primary metric.
Compare Prompt Versions With A/B Tests, Confidence Intervals, and Sample Size Planning
Use statistical tests to show whether a prompt change improved the primary metric. Before you compare anything, lock that metric in. Picking it after you see the results is just cherry-picking with extra steps.
Sample size matters more than many teams think. A 10-point lift may need about 194 samples per variant, while a 2-point lift may need about 5,000. If your traffic can't support that, use offline testing on a fixed golden set instead.
For offline comparisons on the same inputs, use a paired test. Go with Wilcoxon for non-normal scores and a paired t-test for normal scores. If you're testing several metrics at once, apply the Bonferroni correction by dividing alpha by the number of metrics. Otherwise, the false-positive rate climbs fast. Testing three metrics at alpha 0.05 pushes that rate to about 14%.
For live A/B tests, assign users by hashing a stable user ID so each person sees the same variant for the full test.
These test results then feed version tracking, promotion rules, and monitoring.
Connect Prompt Evaluation to a Production Workflow
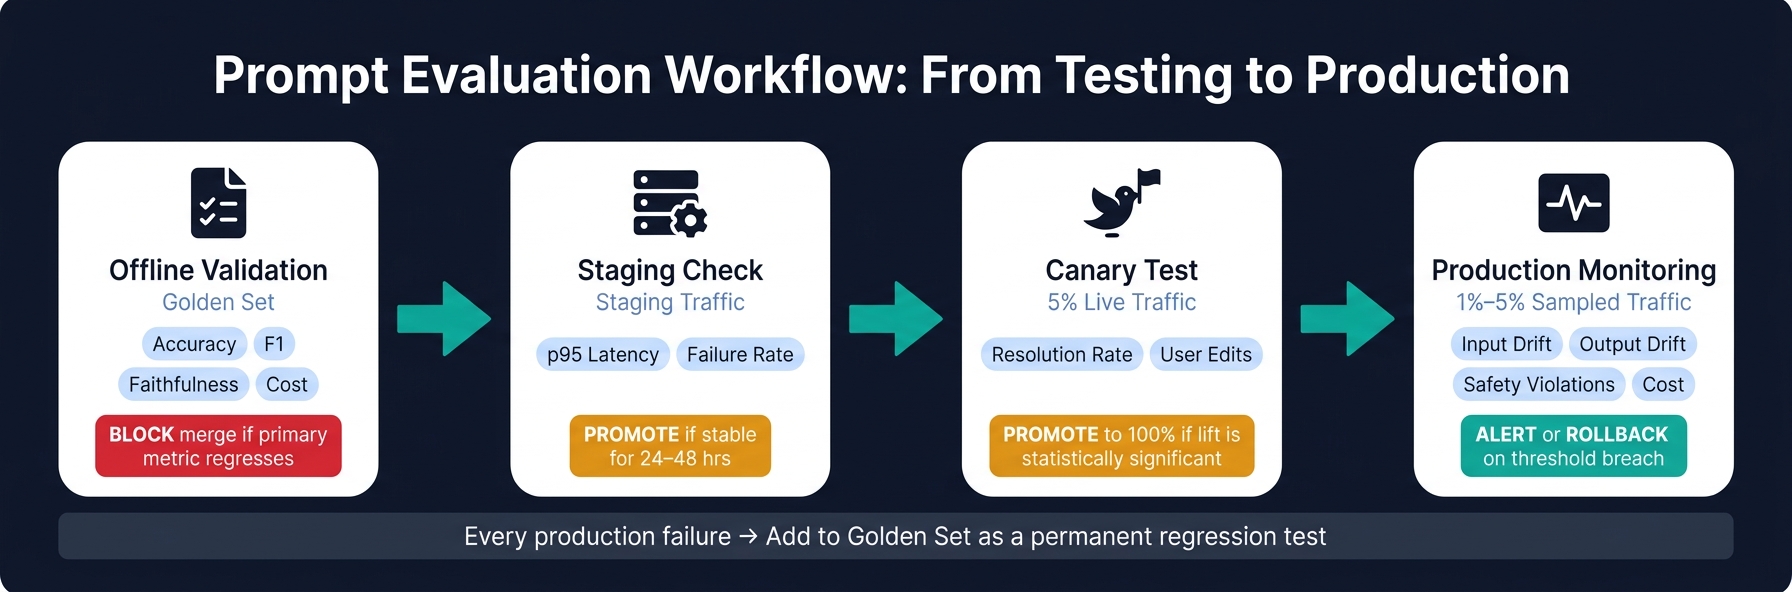
Prompt Evaluation Workflow: From Testing to Production
Once you can compare prompts in a dependable way, the next step is to plug those scores into the way your team ships work. That means version control, release gates, and live monitoring. If evaluation lives only in a spreadsheet, it doesn't do much. The numbers may look neat, but they won't help you ship better prompts.
Track Prompt Versions, Logs, and Regression Baselines
Every evaluation result needs to point to a specific prompt version. A score without version context is hard to use - you can't reproduce it, compare it, or roll back to it.
At a minimum, your team should log:
- Prompt version ID
- Request and response logs
- Trace IDs
- Token counts
- Latency
- Outcome labels, such as user acceptance or rejection
Without that setup, it's tough to know what caused a drop in quality. Was it the prompt? A model update? A shift in user behavior? You need the trail.
Regression testing is what stops quiet failures from slipping into production. Run your evaluation suite automatically on every prompt edit, every model version update, and every infra change, like a retrieval index swap.
Your golden set is the anchor here. Give it a clear owner - one person who keeps it clean, removes stale examples, and adds new permanent test cases based on production incidents.
Use PromptOT to Control Prompt Changes and Link Them to Metrics
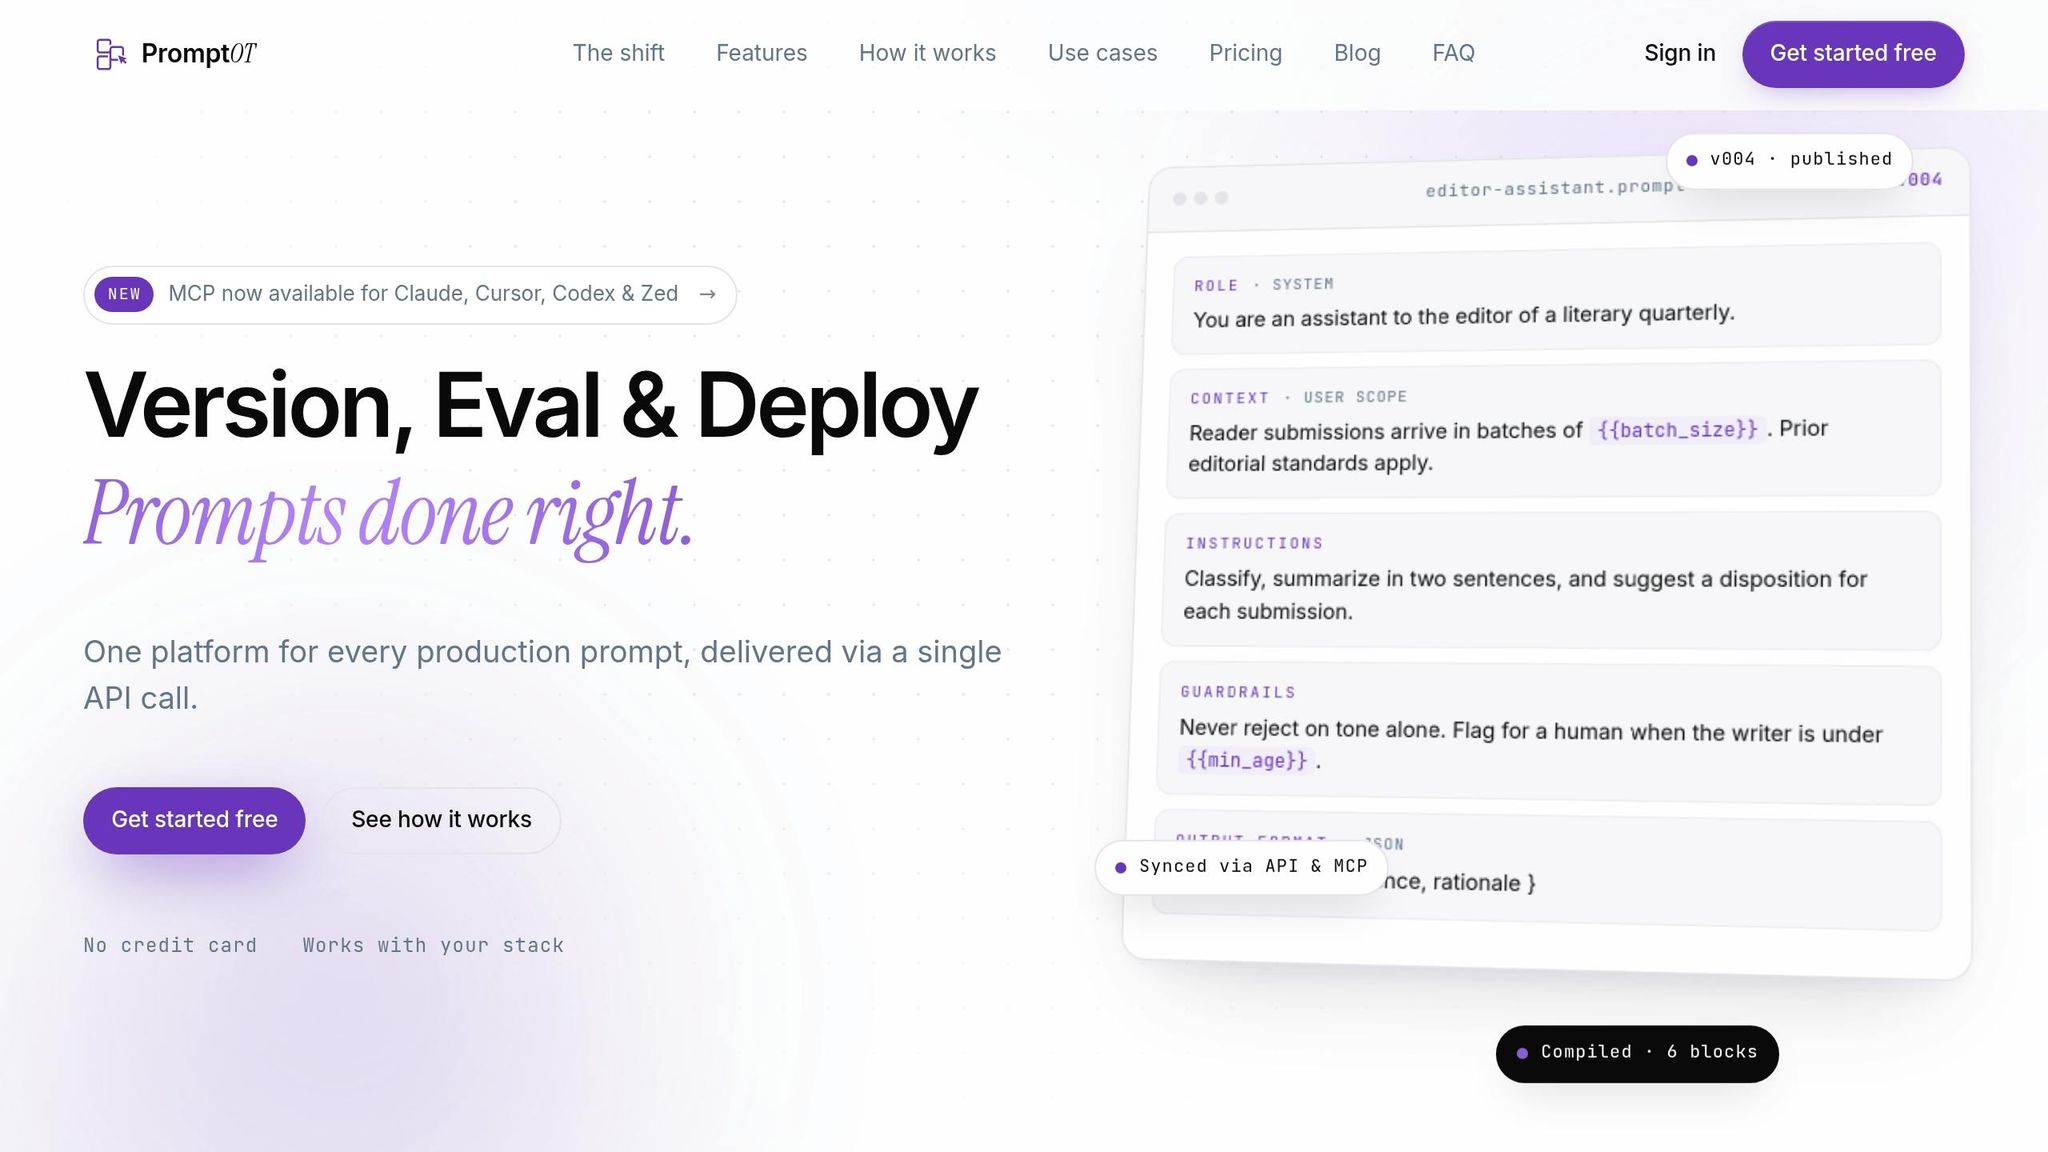
Versioned prompt management makes evaluation reproducible and rollback immediate. PromptOT organizes prompts as typed blocks with full version history, then sends them to your app through one API call.
That setup means every evaluation score maps to the exact published version that produced it. If a new version regresses, rollback is instant. Runtime {{placeholders}} keep golden-set inputs reusable across versions. And webhook notifications can kick off downstream evaluation jobs automatically whenever a prompt is published.
Set Thresholds for Promotion, Alerts, and Ongoing Monitoring
Define your release gates with numbers before you run tests.
For most teams, the core gates are simple: minimum accuracy or F1 on the golden set, a minimum faithfulness score or maximum safety-violation rate, a p95 latency cap, and a cost budget in USD. If any gate fails, block promotion - don't treat it like a friendly suggestion.
Use those same metrics for promotion rules, canary checks, and production alerts. That way, your team isn't judging one way offline and another way in production.
| Phase | Inputs | Outputs | Key Metrics | Decision/Gate |
|---|---|---|---|---|
| Offline Validation | Golden set | Per-version scores | Accuracy, F1, faithfulness, cost | Block merge if the primary metric regresses beyond the allowed threshold |
| Staging Check | Staging traffic | Trace logs | p95 latency, failure rate | Promote if stable for 24–48 hours |
| Canary Test | Live production traffic (5%) | Comparative metrics | Resolution rate, user edits | Promote to 100% if lift is statistically significant |
| Production Monitoring | 1%–5% sampled live traffic | Drift alerts | Input drift, output drift, safety violations, cost | Alert or rollback on threshold breach |
Once a prompt is live, a static golden set won't catch every problem. Sampling 1%–5% of production traffic for continuous scoring helps you spot input drift that offline tests can miss.
There's a simple rule here: treat every production failure as a new regression case and add it to the golden set. When a failure shows up, fix the failing case instead of rewriting the prompt.
Conclusion: A Simple Framework for Measuring and Improving Prompts
Prompt evaluation is a repeatable way to balance quality, safety, latency, and cost as prompts change over time. Once you put numbers behind prompt changes, improvement stops feeling like guesswork. You measure, compare, and ship only when the results are better.
The workflow is pretty simple: use a golden set of real inputs, pick metrics that fit the task, combine automated scoring with human review, and ask for statistical proof before you promote a change. That kind of discipline turns prompt work into engineering instead of trial and error.
Key Takeaways for AI Teams Shipping LLM Features
For teams shipping LLM features, the checklist is simple:
- Start with a golden set, track quality and system metrics, and require statistical evidence before shipping. A set of 100 examples is generally the point where LLM-as-judge scores stabilize and noise stops dominating real differences.
- Automate regression checks. Integrate your evaluation suite into CI/CD and block merges when a prompt regresses past your threshold.
- Use PromptOT to version prompts and tie each published change to evaluation runs.
- Sample live traffic continuously. Sample 1%–5% of production requests to catch input drift that your golden set won't surface.
Teams that measure, version, and monitor prompts ship with more consistency than teams that rely on intuition.
FAQs
How do I choose a primary metric for my prompt?
Choose the metric that best matches the result your users care about most. Base it on actual user needs, not generic benchmarks.
Start with 3–5 quality criteria linked to user complaints or functional requirements, such as:
- task success rate
- faithfulness
- format compliance
In many cases, task success rate is the best primary metric. It maps closely to whether the system did the job people needed it to do.
Just make sure that metric can be measured the same way every time and that it changes when your prompts change. If it stays flat no matter what you edit, it won’t help much.
When should I use human review instead of an LLM judge?
Use human review when you’re defining or refining evaluation criteria. Automated metrics can drift fast if reviewers don’t agree on manual scores in the first place.
You also need human review when:
- a prompt change leads to a regression rate above 5%
- you’re working with high-stakes prompts where precision matters
- you need to validate an LLM judge
If human reviewers and the automated judge disagree more than 20% of the time, the rubric needs adjustment.
How big should my golden set be before I trust the results?
It depends on how fine-grained your evaluation needs to be.
As a starting point, 20 to 50 examples can catch major regressions and basic sanity issues. Around 200 examples can detect 10 to 15 percentage point improvements during active development. And 500+ examples give you the level of confidence most teams want for production decisions, especially when you're looking for 5 to 7 point shifts.
The sample size matters, but the type of data matters just as much. Use real production inputs whenever you can, and make sure your set includes edge cases, messy inputs, and a mix of scenarios. That helps cut down confirmation bias and gives you a more honest read on how the system performs.